Graphic Organisers
|
Graphic Organisers help you organise information in a way that explain or illustrate conceptual understandings. Information is clustered together so as to support / illustrate ideas. For example, a timeline shows the chronological development of an event or progression of a process. A Venn diagram shows the similarities and differences between two ideas / objects. A matrix allows you to compare several ideas / topics using the same criteria.
The quick 2 minute video here explains some of the uses of Graphic Organisers. |
|
Venn Diagram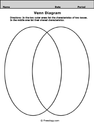
|
Semantic Grid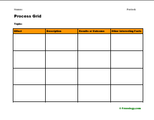
|
Fact /Opinion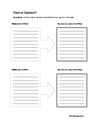
|
Timeline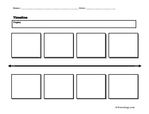
| ||||||||
Chain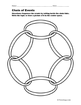
This organiser allows you to sequence events
|
T Chart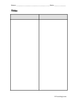
|
Fishbone
|
Spider Chart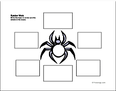
| ||||||||
